


Key Takeaways
- Audit in 3 Structured Phases: A successful CRO audit follows a clear sequence: Prepare, Diagnose and Execute.
- Fix Technical Leaks First: Slow load times (over 2.5s) and missing security signals drive users away before they ever evaluate your offer.
- Observe Real User Behavior: Pair quantitative drop-off data with qualitative tools to discover why visitors leave.
- Clear Copy Beats Clever Copy: High-converting landing pages pass the 5-second test by explicitly stating what you offer, where you operate and why you are the best choice without corporate jargon.
- Prioritize with the ICE Matrix: Score every A/B testing opportunity on Impact, Confidence and Effort to focus on high-reward yet low-effort wins first.
- Follow a 30–60–90 Day Roadmap: Resolve immediate technical bugs and messaging mismatches in Month 1, A/B test core copy and forms in Month 2 and execute complex template and funnel redesigns in Month 3.
Most landing pages fail because businesses overlook the elements that influence users' decisions to act. Confusing layouts, slow load times, weak messaging and unnecessary friction stop visitors before they reach the offer.
A Conversion Rate Optimization (CRO) audit exposes these problems. This process turns guesswork into clear insights, showing why a landing page underperforms.
This guide explains how a complete CRO audit works and how it uncovers the issues that block conversions. We made this to help you fix landing page problems and strengthen results across your campaigns.
Below, we discuss:
- What Is A CRO Audit?
- When You Should Run A CRO Audit
- Types and Levels of CRO Audit
- How to Run a Comprehensive Conversion Optimization Audit
- The Complete CRO Checklist
- Common CRO Assessment Mistakes and How to Avoid Them
What Is A CRO Audit?
A CRO audit is a detailed review of the factors that influence conversions across your full funnel. It examines data, user behavior, design, copy and technical performance to find the points where visitors hesitate or drop off. The goal is to identify what prevents users from taking action and show the fixes that improve results.
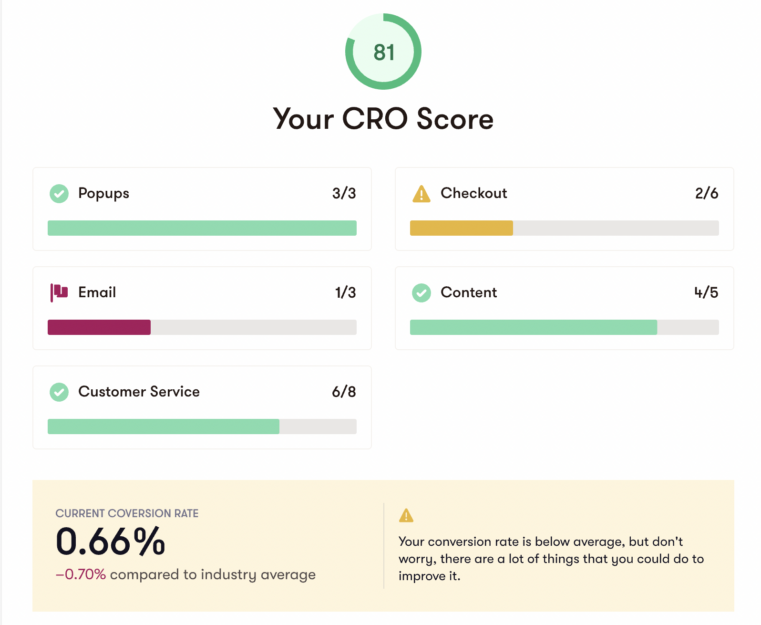
Conversion Optimisation Audit Example
Source: Mayple
Brands invest in a conversion rate optimization audit because the old approach of buying more traffic no longer delivers consistent results. Ad costs continue to rise and privacy limits make targeting less predictable.
A CRO assessment increases revenue by improving the performance of the traffic you already have. It strengthens the user journey and gives companies a reliable way to lift conversions without relying on bigger budgets.
When You Should Run a CRO Audit
Knowing when to run a conversion audit helps teams catch issues early and maintain steady performance. Certain events create conditions where a full review is necessary. The following are the most common scenarios:
- A major redesign or platform migration
- A sudden spike in traffic without a matching lift in conversions
- A new product launch or a major campaign
- A consistent decline in conversions, average order value or lead quality
But beyond these large events, CRO audits work best on a predictable schedule. This keeps small friction points from turning into major drop-offs and ensures your site adapts as user behavior evolves.
Types and Levels of CRO Audit
A conversion rate optimization audit can take several forms depending on the structure of the site and the goals of the business. Each type looks at user behavior from a different angle and helps reveal specific issues that affect performance.
Businesses that understand the levels of a conversion rate optimization audit find it easier to choose the right scope and build a clear improvement plan.
Macro Conversion vs Micro Conversion Audits
A macro conversion audit reviews the actions that drive revenue. These include purchases and trial signups. Examining these outcomes helps identify friction at the most important points in the funnel.
On the other hand, a micro conversion audit looks at the smaller actions that signal early engagement. Add-to-cart clicks, scroll depth, video views and email signups show how users move through the experience before reaching a final decision. These signals make it possible to detect problems before they affect revenue.
| Macro Conversions | Micro Conversions | |
|---|---|---|
| Typical Actions |
|
|
Funnel-Based Audits
A funnel-based audit reviews how users move through awareness, consideration, conversion and retention. It shows where users enter the journey and where they fall off. This view reveals whether the experience supports steady progress or creates confusion that leads to exits.
A page-type audit focuses on how well each page supports the user. Homepages and category pages shape early navigation. Product pages and comparison pages influence evaluation and intent. Cart pages, checkout flows and key landing pages have the strongest impact on final conversions.
Reviewing each page type separately helps pinpoint issues that may not appear in broader funnel data. It also shows where small improvements can create meaningful gains in the overall conversion path.
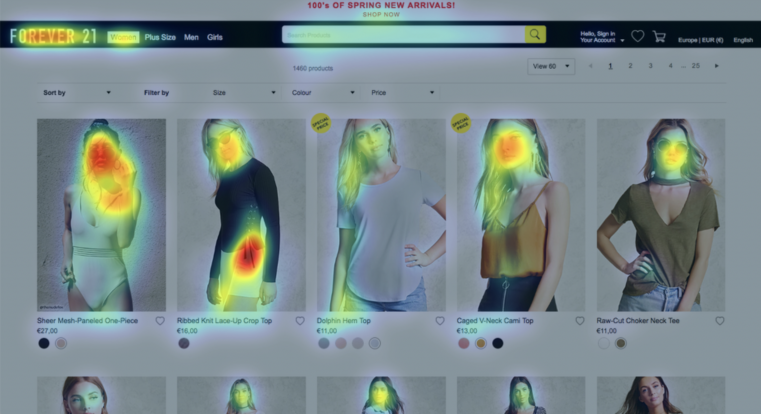
Landing Page Heatmap Audit Example
Source: Eye Quant
Channel-Specific Audits
A channel-specific audit examines how different traffic sources perform.
Paid search and paid social often lead to landing pages that require tight message matches. Organic content funnels move users from a blog post to a resource page and then to a lead action. Email, remarketing and lifecycle flows shape behavior after the first visit.
Each channel brings users with different expectations, so reviewing performance at this level helps strengthen conversions across the full customer journey. This also reveals which channels deserve greater investment based on how well they drive qualified users.
How to Run a Comprehensive Conversion Optimization Audit
A conversion optimization audit works best when it follows a straightforward process. Each stage reveals a different factor that shapes user behavior and conversion performance. This section walks through that sequence step by step and shows how teams can use it to uncover issues and build a plan that drives stronger results.
Phase 1: Prepare
Before diagnosing why visitors leave, you need clean data to establish what is actually happening across your site.
Step 1: Lay the Foundation
Accurate data is the backbone of any audit. If tracking is broken, every insight that follows will be flawed.
The process starts by clarifying core business goals to align the audit with high-level targets. With clear metrics established, audit your tracking setup to ensure event and funnel tracking fires accurately.
Step 2: Quantitative Funnel and Segment Analysis
Quantitative metrics act as your site's diagnostic blueprint. It precisely identifies where potential customers abandon their journey so that you can focus your optimization efforts on the highest-friction drop-off points.
Let's say you are an HVAC business owner offering online installation estimates. These are the tactics you can execute:
Funnel Drop-Off Mapping
Here, you trace the sequential path visitors take from the initial visit to the final conversion. This is the ideal path:
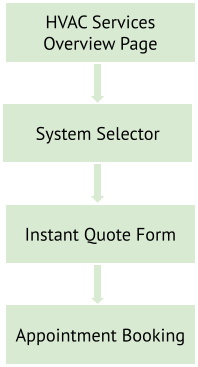
If 1,000 visitors land on the system selector page, 800 proceed to the instant quote form, but only 50 submit a booking, the quote form is your primary conversion bottleneck.
Segment Comparisons
Segmenting quantitative data lets you look beyond sitewide averages and evaluate how different audiences navigate your conversion paths. By breaking down performance into distinct groups, you can pinpoint where specific user subsets encounter friction and prioritize fixes that yield the highest return.
Example #1: Device Type (Mobile vs. Desktop on Form Friction Analysis)
Mobile users experience significant friction with form fields when completing multi-step HVAC booking forms on small screens.
| Metric | Desktop | Mobile | CRO Takeaway |
|---|---|---|---|
| Booking Completion Rate | 4.5% | 1.1% | Clumsy input fields and dropdowns on mobile cause a 75% drop in conversion compared to desktop. |
| Form Abandonment Rate | 35.0% | 78.5% | Mobile forms require tap-to-call buttons and step-by-step micro-forms. |
| Average Form Fields Completed | 8 / 8 | 3 / 8 | Reduce mobile form fields from 8 fields down to 3 required inputs. |
Example #2: User Type (First-Time Homeowners vs. Returning Clients)
First-time homeowners experiencing an urgent HVAC failure carry high anxiety and require strong trust signals, whereas returning clients convert at higher rates due to established brand familiarity.
| Segment | Primary Motivation | Conversion Rate | Key Friction Point | Optimization Focus |
|---|---|---|---|---|
| First-Time Homeowners (Urgent AC Failure) | Fast emergency repair service | 8.2% | Price uncertainty and technician trust | Prominent display of fixed pricing guarantees and Google reviews. |
| Returning Clients (Seasonal Maintenance) | Routine maintenance and system checkups | 14.5% | Login friction and scheduling delays | One-click SMS booking links and direct customer portal logins. |
Path Analysis
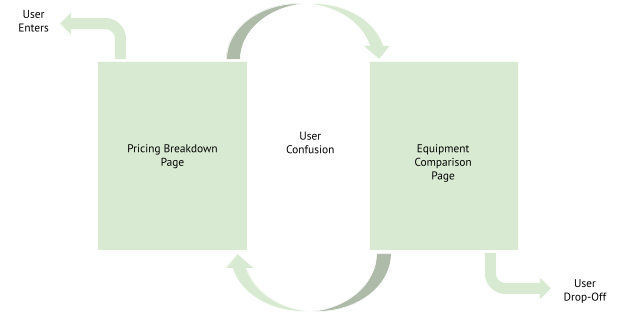
Examine user navigation streams to identify confusion loops. For instance, if visitors repeatedly bounce back and forth between the pricing breakdown page and the equipment comparison chart, your messaging lacks the clarity needed for them to select confidently.
Phase 2: Diagnose
Once quantitative data highlights where visitors drop off, qualitative and on-page assessments reveal why they hesitate or leave. Phase 2 moves beyond raw metrics to evaluate the persuasive power of your site.
Step 3: Technical and Site Speed Performance
A site can look visually appealing and still lose conversions due to hidden technical friction. Slow loading times or unresponsive elements create immediate hesitation, driving visitors to abandon the page before they ever evaluate your offer.
Use this quick checklist to test the core technical areas of your site:
Page Speed and Load Stability
- ☐ Load Time: Run your main pages through Google PageSpeed Insights. Aim for main content to load in under 2.5 seconds.
- ☐ Visual Stability: Scroll down key pages as they load to make sure buttons and text don't jump around suddenly while loading.
Mobile Usability
- ☐ Screen Fitting: Open your site on a smartphone and check that no content spills off the side (no horizontal scrolling).
- ☐ Easy Tapping: Confirm buttons and form fields are large enough to tap easily with a thumb without accidentally clicking nearby links.
- ☐ Smart Keypads: Tap the phone number or ZIP code field to ensure the smartphone automatically opens the numeric keypad instead of the full text keyboard.
Forms and Functional Reliability
- ☐ Form Testing: Fill out and submit every form on your site (mobile and desktop) to verify that submissions go through and trigger the correct "Thank You" message.
- ☐ Broken Elements: Scan key pages for broken links or missing images that fail to open.
Security and Trust Signals
- ☐ SSL Verification: Check that the padlock icon displays in the address bar across all pages (HTTPS).
- ☐ Trust Badges: Ensure payment badges, security seals or guarantee logos are clearly visible near quote forms and checkout buttons.
Step 4: Qualitative User Experience (UX) Diagnostics
While behavioral data show you where users exit, qualitative diagnostics reveal the specific visual and interaction barriers that cause their frustration. Observing real user activity bridges the gap between what users say they do and how they actually interact with your site.
Here are the tools you can use:
| Diagnostic Tool | Description and Key Focus | Behavioral Signals and Indicators | Optimization Focus and Action |
|---|---|---|---|
| Heatmaps and Scroll Depth Analysis | Aggregated visual data that exposes how visitors visually engage with page elements and layouts. |
|
|
| Session Recordings | Direct observation of real user navigation journeys across your conversion paths. |
|
|
| Task-Based Usability Testing | Guided testing with external individuals performing specific tasks |
|
|
| Voice-of-Customer (VoC) Insights | Direct qualitative feedback captured through surveys, reviews and support channels to uncover underlying objections. |
|
|
Step 5: Copy, Offer and Persuasion Assessment
Even if a site loads instantly and offers seamless navigation, weak or ambiguous messaging will prevent visitors from taking action. Your copy must clearly communicate value and minimize perceived risk.
Below are examples demonstrating how messaging shifts from weak copy to high-converting copy:
Example 1: Headline and Value Proposition
"Innovative Climate Solutions for Modern Living"
Why It Fails: It uses corporate jargon that fails the "5-second test." The visitor has no idea if you sell air conditioners or consult on commercial building insulation. It forces the user to expend cognitive effort to guess what you actually do.
"Same-Day AC Repair in Austin — Fixed Right the First Time or It’s Free"
Why It Works: It immediately states what the service is (AC Repair), where it operates (Austin), how fast it happens (Same-Day) and why it is risk-free (It’s Free if not fixed right). The value is crystal clear within two seconds of landing on the page.
Example 2: Call-to-Action (CTA) and Risk Reversal
Button Text: "Submit Request"
Supporting Copy: "A representative will contact you during business hours to process your application."
Why It Fails: Words like "Submit" and "Application" sound like tedious work. Stating that someone will contact them "during business hours" creates uncertainty about when or if they’ll hear back and can discourage them from proceeding.
Button Text: "Get My Free Instant Quote"
Supporting Copy: "Takes 30 seconds • No credit card required • Zero obligation"
Why It Works: The button uses action-oriented language ("Get My Free Instant Quote"). The micro-copy directly beneath the button addresses key user anxieties by removing commitment risk ("No credit card required").
Phase 3: Execute
An audit is only as valuable as the actions that follow. Gathering insights and analytics drop-offs is meaningless if those findings sit in a presentation deck. Phase 3 transforms your discoveries into an organized operational plan.
Step 6: Findings Prioritization (The ICE Matrix)
A comprehensive conversion optimisation audit produces dozens of potential changes, but attempting to fix everything at once leads to team burnout and diluted results. To maximize your return on effort, group your findings by domain and filter them into two operational tracks:
- Direct Fixes (Just Do It): Obvious bugs, broken forms, missing tracking tags or slow image load times require no testing. So, they can be fixed immediately.
- A/B Test Hypotheses: Major layout overhauls or offer restructuring require hypothesis-driven experiments to validate performance gains before permanent deployment.
To rank your A/B testing opportunities objectively, score each item using the ICE (Impact, Confidence, Effort) Prioritization Model on a scale from 1 (lowest) to 10 (highest) across three core criteria:
Impact (1–10): How much conversion lift will this produce if successful?
High Score (8–10): Changes to high-intent pages (checkout flows, primary value propositions, hero CTAs).
Low Score (1–3): Changes to low-traffic or low-intent areas (tweaking footer links, policy page layouts).
Confidence (1–10): How strong is the evidence backing this change?
High Score (8–10): Hypotheses supported by multiple data sources (e.g., GA4 drop-off data + heatmap rage clicks + survey feedback).
Low Score (1–3): Ideas based purely on personal opinion, design preference or unvalidated competitor copying.
Effort (1–10): How simple is this change to design or code?
High Score (8–10): Low-effort and quick-turnaround changes (e.g., updating button copy, changing headline text, reordering form fields).
Low Score (1–3): High-effort and resource-heavy builds (e.g., custom interactive pricing calculators, multi-step funnel architecture redesigns).
To calculate the overall priority score, multiply the three sub-scores together:

Because each metric is rated on a 1-to-10 scale, the final ICE score ranges from 1 to 1,000. Items with the highest total scores naturally rise to the top of your roadmap, ensuring your team tackles high-impact yet low-effort wins first.
Example: Scoring Audit Findings
| Opportunity / Hypothesis | Impact (1–10) | Confidence (1–10) | Effort (1–10)* | Total ICE Score | Operational Action |
|---|---|---|---|---|---|
| Headline and Sub-headline Rewrite: Change generic tagline to same-day service value proposition on the main landing page. | 8 | 9 | 9 | 648 | High Priority (Week 1 Test) |
| Mobile Form Field Reduction: Cut required quote form fields from 8 to 4 based on mobile exit recordings. | 9 | 8 | 8 | 576 | High Priority (Week 2 Test) |
| Add Guarantee Badge: Place a "100% Satisfaction Guarantee" seal directly beneath the primary booking CTA. | 6 | 7 | 10 | 420 | Medium Priority (Quick Win) |
| Custom Interactive Calculator: Build an interactive 4-step HVAC system sizing tool to assist product selection. | 8 | 6 | 3 | 144 | Low Priority (Q3 Project) |
*Note: Effort uses an inverse score where 10 = minimal work (fast) and 1 = extensive engineering (slow).
Step 7: The 30–60–90 Day Execution Roadmap
An audit only creates value when you put its insights into action. The 30–60–90 day execution roadmap organizes your prioritized list into three structured monthly phases.
Days 1–30: Quick Wins and Critical Repairs
The first month focuses on patching immediate revenue leaks and fixing obvious technical errors that require no A/B testing.
- Fix Technical and Mobile Bugs: Resolve broken form validation fields and alignment errors on mobile screens.
- Resolve Messaging Mismatches: Update landing page headlines so they immediately match the wording and intent of incoming ad traffic.
- Deploy Low-Effort Trust Signals: Add security seals and clear guarantee badges near high-friction action buttons.
Days 31–60: High-Impact Testing and Offer Optimization
Once the site is technically sound, spend month two running targeted A/B tests on form length and offer presentation.
- Headline and Value Proposition Tests: Test benefit-driven headlines against your baseline messaging to see which captures user attention faster.
- Form Field Reductions: Experiment with removing non-essential form fields on mobile
- CTA and Risk-Reversal Iterations: Test action-oriented button text ("Get My Free Instant Quote") paired with low-risk micro-copy ("Takes 30 seconds • Zero obligation").
Days 61–90: Structural Overhauls and Funnel Redesigns
The final month tackles deeper user experience friction points that require dedicated design and development resources. By this stage, minor tweaks are complete, allowing your team to execute major structural overhauls.
Key Page Template Overhauls
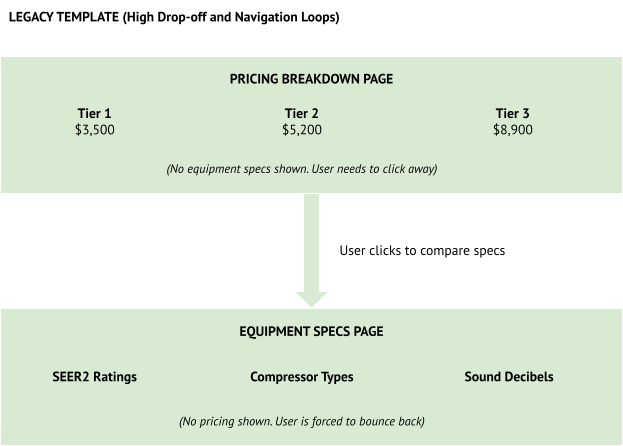
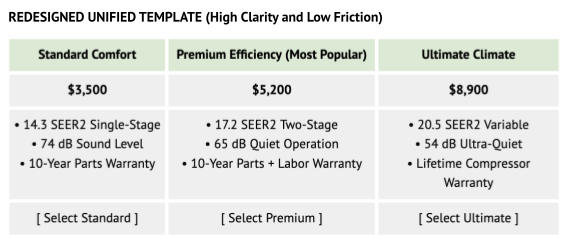
High-drop-off templates often fail because they present dense information. Overhauling these templates involves consolidating scattered data into intuitive visual hierarchies informed by session recordings and heatmap scroll limits.
Example: Pricing and Equipment Comparison Template Overhaul
Funnel Sequence Redesigns
When a checkout or booking process is spread across too many separate pages, every extra click gives visitors a chance to leave. Redesigning your funnel means combining these steps onto a single page so users can complete their booking quickly without losing momentum.
Old Funnel (5 Separate Pages — High Drop-Off)
In the old layout, visitors had to click through five different pages. Each page reload added extra waiting time and friction, causing most visitors to leave before finishing:
- Page 1. Landing Page (100% of visitors arrive)
- Page 2. Select Service (62% stay)
- Page 3. Select Equipment (28% stay)
- Page 4. Enter Address (11% stay)
- Page 5. Choose Date and Confirm (3.2% final conversions)
Redesigned Funnel (3-Step Single-Canvas Micro-Form)
The updated layout puts the entire process on a single interactive screen, broken into three quick steps. Instead of waiting for new pages to load, users fill out their information seamlessly on a single page:
| Step 1 Select Service and System | Step 2 Address and Instant Quote | Step 3 Arrival Window and Confirm |
|---|---|---|
|
|
|
| 100% Entry | 54% Retention | 9.6% Final Conversion |
(Total completed bookings increased from 3.2% to 9.6%.)
The Complete CRO Checklist
Use this actionable CRO audit checklist to execute every phase and step of the conversion optimization process outlined in the audit guide.
Phase 1: Prepare
Step 1: Lay the Foundation
- ☐ Clarify Business Goals: Align audit priorities with core business objectives and target conversion outcomes.
- ☐ Audit Analytics and Event Tracking: Verify event tracking and conversion tags fire accurately across key pages without gaps or duplication.
- ☐ Verify Funnel Tracking: Ensure sequential conversion funnel tracking accurately measures user progression across primary paths.
Step 2: Quantitative Funnel and Segment Analysis
- ☐ Map Funnel Drop-Offs: Trace visitors' sequential routes to pinpoint the exact high-friction bottleneck pages.
- ☐ Analyze Device Types: Evaluate performance across Desktop vs. Mobile to catch device-specific friction.
- ☐ Analyze User Segments: Segment performance by user type.
- ☐ Run Path Analysis: Examine navigation streams to identify confusion loops where users repeatedly bounce between pages.
Phase 2: Diagnose
Step 3: Technical and Site Speed Performance
- ☐ Page Speed and Load Stability: Check key pages to ensure main content loads within 2.5 seconds, and that layout shifts remain stable.
- ☐ Mobile Usability: Verify that content fits properly without horizontal scrolling, that touch targets are easily tappable and that smart keypads trigger automatically.
- ☐ Forms and Functional Reliability: Test every lead form and checkout flow on both desktop and mobile to confirm error-free submissions.
- ☐ Security and Trust Signals: Verify valid SSL encryption (HTTPS) and clear trust badge placement near action points.
Step 4: Qualitative User Experience (UX) Diagnostics
- ☐ Heatmaps and Scroll Depth: Identify dead clicks on non-hyperlinked elements and ensure primary value propositions sit above the fold.
- ☐ Session Recordings: Watch session recordings on exit pages to locate rage clicks, form looping or cursor hesitation.
- ☐ Task-Based Usability Testing: Conduct guided user tests to reveal navigation breakdowns or confusing menu structures.
- ☐ Voice-of-Customer (VoC) Insights: Deploy single-question exit surveys and review chat logs to catch customer objections.
Step 5: Copy, Offer and Persuasion Assessment
- ☐ 5-Second Value Proposition: Confirm primary headlines clearly state the offer, target audience and key benefit within 5 seconds.
- ☐ Call-to-Action (CTA) and Micro-Copy: Replace generic button copy with action-oriented language paired with risk-reversing micro-copy.
- ☐ Risk Reversal & Proof Placement: Position explicit guarantees and verified customer reviews directly next to primary conversion points
Phase 3: Execute
Step 6: Findings Prioritization (The ICE Matrix)
- ☐ Filter Operational Tracks: Immediately route obvious technical bugs into "Just Do It" direct fixes, and assign major layout/copy changes to A/B testing hypotheses.
- ☐ Score Test Hypotheses (1–10 Scale):
- Impact: Rate expected conversion lift.
- Confidence: Rate the strength of supporting data (analytics + recordings + VoC feedback).
- Effort: Rate ease of execution (10 = minimal effort/fast, 1 = extensive build).
- ☐ Calculate Total ICE Scores: Multiply (Impact × Confidence × Effort) to rank items objectively from 1 to 1,000.
Step 7: The 30–60–90 Day Execution Roadmap
- ☐ Days 1–30 (Quick Wins and Critical Repairs): Resolve technical bugs, fix ad-to-landing-page messaging mismatches and deploy low-effort copy or CTA quick wins.
- ☐ Days 31–60 (High-Impact Testing and Offer Optimization): A/B test value proposition headlines and guarantee badge placements.
- ☐ Days 61–90 (Structural Overhauls and Funnel Redesigns):
- Redesign high-drop-off template pages into unified visual layouts.
- Streamline multi-page conversion funnels into single-canvas micro-forms to remove unnecessary reloads and drop-offs.
Common CRO Assessment Mistakes and How to Avoid Them
Even a well-planned audit conversion rate optimization can fall short when teams rely on shortcuts or overlook key details. Understanding the most common mistakes makes the process smoother and helps you avoid wasted time and effort.
The points below outline the most common issues and how to prevent them.
Mistake #1. Treating the Audit as a One-Time Project
Many teams audit conversion rate optimization once and expect long-term results. However, a one-time audit cannot keep up. Continuous audits and regular testing cycles deliver better results because they help you catch new problems early and respond to shifts in user expectations.
Mistake #2. Blindly Copying Competitors
Competitor pages can offer useful ideas, but copying them without context often fails. Your audience and traffic sources may be completely different. Therefore, you must use competitor insights for inspiration, not instructions.
Mistake #3. Over-Relying on One Data Source
A strong audit draws insights from several sources.
If you rely only on analytics, you miss the "why" behind user behavior. If you rely only on heatmaps or only on UX opinions, you miss the broader story. The best decisions come from combining data and direct observation.
Mistake #4. Ignoring Segmentation
High-value segments often behave differently from general traffic. When you ignore segmentation, you risk fixing non-existent issues and missing issues that cost you revenue. So, always compare groups such as new and returning users or mobile and desktop users.
Mistake #5. Running Tests Without Proper Tracking or Sample Size
Tests only work when the data is accurate. Make sure tracking is correct, and the test runs long enough to produce reliable results.
These mistakes are common because CRO can feel simple on the surface, even though it requires careful analysis and ongoing effort. The best way to avoid these pitfalls is to work with a professional experienced in running full CRO audits and managing continuous testing. A trained specialist can spot problems faster and build a strategy that delivers reliable long-term gains.
Partner With Thrive for Professional CRO Solutions
A strong CRO website audit uncovers the opportunities that drive real growth. But the work does not end with an audit. Lasting improvements require expert implementation and a team that understands how design, messaging, data and user behavior all connect.
Thrive Internet Marketing Agency provides the professional support needed to turn CRO insights into successful outcomes. Our team combines strategy, analytics, creative execution and technical expertise to improve conversions across every part of your digital presence.
Partnering with Thrive gives you access to a complete set of solutions that strengthen performance and support long-term growth:
- Conversion Rate Optimization Services
- CRO Audit Services
- Content Writing Services
- Web Design Services
- Google Analytics Services
With Thrive, you gain a partner who understands how to resolve conversion issues and continually improve. We want to help. Contact us today.
Frequently Asked Questions
What is the purpose of a CRO audit?
A CRO website audit examines how users interact with your site and identifies obstacles that prevent them from completing key actions. It reviews data, user behavior and the overall experience to find opportunities for improvement. Unlike general website reviews, a CRO audit focuses on actions that influence leads or sales.
How is a CRO audit different from regular website maintenance?
Website maintenance focuses on updates, security and basic functionality. A CRO website audit goes deeper by examining how well each part of the site supports user decisions. It looks at messaging, layout, user paths and performance to understand how each element affects conversions.
Do I need a CRO audit if my site already performs well?
Even a strong site benefits from periodic review. User expectations change, and new friction points appear over time. An audit conversion rate optimization process helps catch issues early and keeps the experience aligned with user behavior.
How long does a full CRO audit take?
The timeline varies based on the size of the site and the depth of the review. A smaller site may take a few weeks, while a larger one with complex user paths may require more time. The goal is to gather enough evidence to guide clear improvements.
What should I prepare before starting a CRO audit?
Make sure your analytics tools are set up correctly and tracking the right events. Have your primary goals defined and ensure your team can access the necessary data. A well-prepared CRO audit checklist streamlines the process and helps ensure that no important step is missed.
Can a CRO audit improve traffic quality?
A CRO audit does not directly increase traffic, but it can improve how well current traffic performs. When users experience clearer messaging and fewer roadblocks, the same volume of traffic produces better results.
Should I run a CRO audit myself or hire a professional?
Basic reviews are manageable for many teams, but a full conversion optimisation audit requires expertise in analytics, UX and testing. A professional brings experience, proven frameworks and an unbiased view of the site.
How often should I update my CRO audit checklist?
Review your CRO checklist each time you run a full audit or make major changes to your site. Updating it ensures you stay aligned with new user behavior trends and evolving marketing goals.
What makes a CRO audit different from a redesign?
A redesign focuses on changing the look or structure of a site, often based on creative direction or brand goals. A CRO audit focuses on user behavior and performance data. The goal is not to change the site for the sake of appearance but to improve how well it supports user actions.
How soon can I expect results after implementing CRO recommendations?
Some improvements produce quick gains, especially when they remove obvious friction. Others require testing and iteration, which may take more time. Most businesses begin to see meaningful performance lifts within a few weeks to a few months, depending on traffic volume and the scope of changes made.